Climate and Weather Charts
Brisbane Airport (BNE)
(Brisbane, Queensland - QLD, Australia)

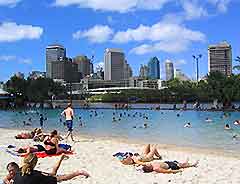
Brisbane is located on the eastern coast of Australia, in the southern hemisphere, and features a subtropical climate with hot, humid summer months, between December to February. Standing next to the Pacific Ocean, Brisbane is close to both the Sunshine Coast and Gold Coast, two legendary stretches of sandy shorelines and beaches.
Night-time temperatures in Brisbane remain mild and warm throughout the year, even during the winter months, from June to August. January generally offers the hottest climate in Brisbane, during the height of the summer, when temperatures peak at around 30°C / 86°F. Summers in Brisbane can be fairly humid, featuring the wettest weather, although showers are usually quick to clear. The average annual daytime temperatures in Brisbane are around 25°C / 78°F.
Climate Description: Subtropical climate
Brisbane Airport (BNE) Location: Southern Hemisphere, Australia, Queensland
Annual High / Low Daytime Temperatures at Brisbane: 29°C / 20°C (84°F / 68°F)
Average Daily January Temperature: 29°C / 84°F
Average Daily June Temperature: 21°C / 70°F
Annual Rainfall / Precipication Brisbane at Airport (BNE): 1199 mm / 47 inches
Brisbane Airport (BNE):
Climate and Weather Charts
Temperature Chart |
| Temperatures |
Jan |
Feb |
Mar |
Apr |
May |
Jun |
Jul |
Aug |
Sep |
Oct |
Nov |
Dec |
Average |
Maximum
Celcius (°C) |
29 |
29 |
28 |
26 |
23 |
21 |
20 |
22 |
24 |
26 |
28 |
29 |
25 |
Minimum
Celcius (°C) |
21 |
21 |
19 |
17 |
13 |
11 |
10 |
10 |
13 |
16 |
18 |
20 |
16 |
Maximum
Fahrenheit (°F) |
84 |
84 |
82 |
79 |
73 |
70 |
68 |
72 |
75 |
79 |
82 |
84 |
78 |
Minimum
Fahrenheit (°F) |
70 |
70 |
66 |
63 |
55 |
52 |
50 |
50 |
55 |
61 |
64 |
68 |
60 |
Rainfall / Precipitation Chart |
| Rainfall |
Jan |
Feb |
Mar |
Apr |
May |
Jun |
Jul |
Aug |
Sep |
Oct |
Nov |
Dec |
Total |
| Rainfall (mm) |
165 |
173 |
152 |
89 |
84 |
81 |
64 |
46 |
33 |
99 |
94 |
119 |
1199 |
| Rainfall (inches) |
6.5 |
6.8 |
6.0 |
3.5 |
3.3 |
3.2 |
2.5 |
1.8 |
1.3 |
3.9 |
3.7 |
4.7 |
47 |
Seasonal Chart |
| Seasons |
Average
Temp
(Max °C) |
Average
Temp
(Min °C) |
Average
Temp
(Max °F) |
Average
Temp
(Min °F) |
Total
Rainfall
(mm) |
Total
Rainfall
(inches) |
| Mar to May (Autumn / Fall) |
26 |
16 |
78 |
61 |
325 |
13 |
| Jun to Aug (Winter) |
21 |
10 |
70 |
51 |
191 |
8 |
| Sept to Nov (Spring) |
26 |
16 |
79 |
60 |
226 |
9 |
| Dec to Feb (Summer) |
29 |
21 |
84 |
69 |
457 |
18 |
 Brisbane is located on the eastern coast of Australia, in the southern hemisphere, and features a subtropical climate with hot, humid summer months, between December to February. Standing next to the Pacific Ocean, Brisbane is close to both the Sunshine Coast and Gold Coast, two legendary stretches of sandy shorelines and beaches.